How much will it cost to power the World Cup this Winter?

With the high cost of energy being the matter of the moment, it’s only natural to wonder how much large-scale events, such as the 2022 Qatar World Cup would cost to power – and, to consider what will become of these much loved sporting events if we don’t do more to reduce the environmental impact of running such events by switching to renewable energy resources more quickly. Large-scale sporting events use a massive amount of energy through venues, transport, air conditioning, lighting, and more.
The World Cup is a global sporting tradition, with millions of fans tuning in or flying into the event from all over the world, but carbon-neutral changes for the protection of the planet still needs improvement.
We know that carbon-neutral football is possible; take last year’s first entirely net-zero football match at the Tottenham Hotspur stadium. Since then, Tottenham has committed to making matches at their stadium net-zero and are top of the Premier League sustainability table for a third year running. If anyone should follow in the footsteps of Tottenham, FIFA could put this example onto the world stage.
With this in mind, we’ve estimated the overhead costs of fuelling an event like the World Cup and have compared the cost of hosting the World Cup in various countries including Qatar, as well as working out the most eco-friendly locations that have hosted it previously.
How Much Is The Qatar 2022 World Cup Costing In Energy?
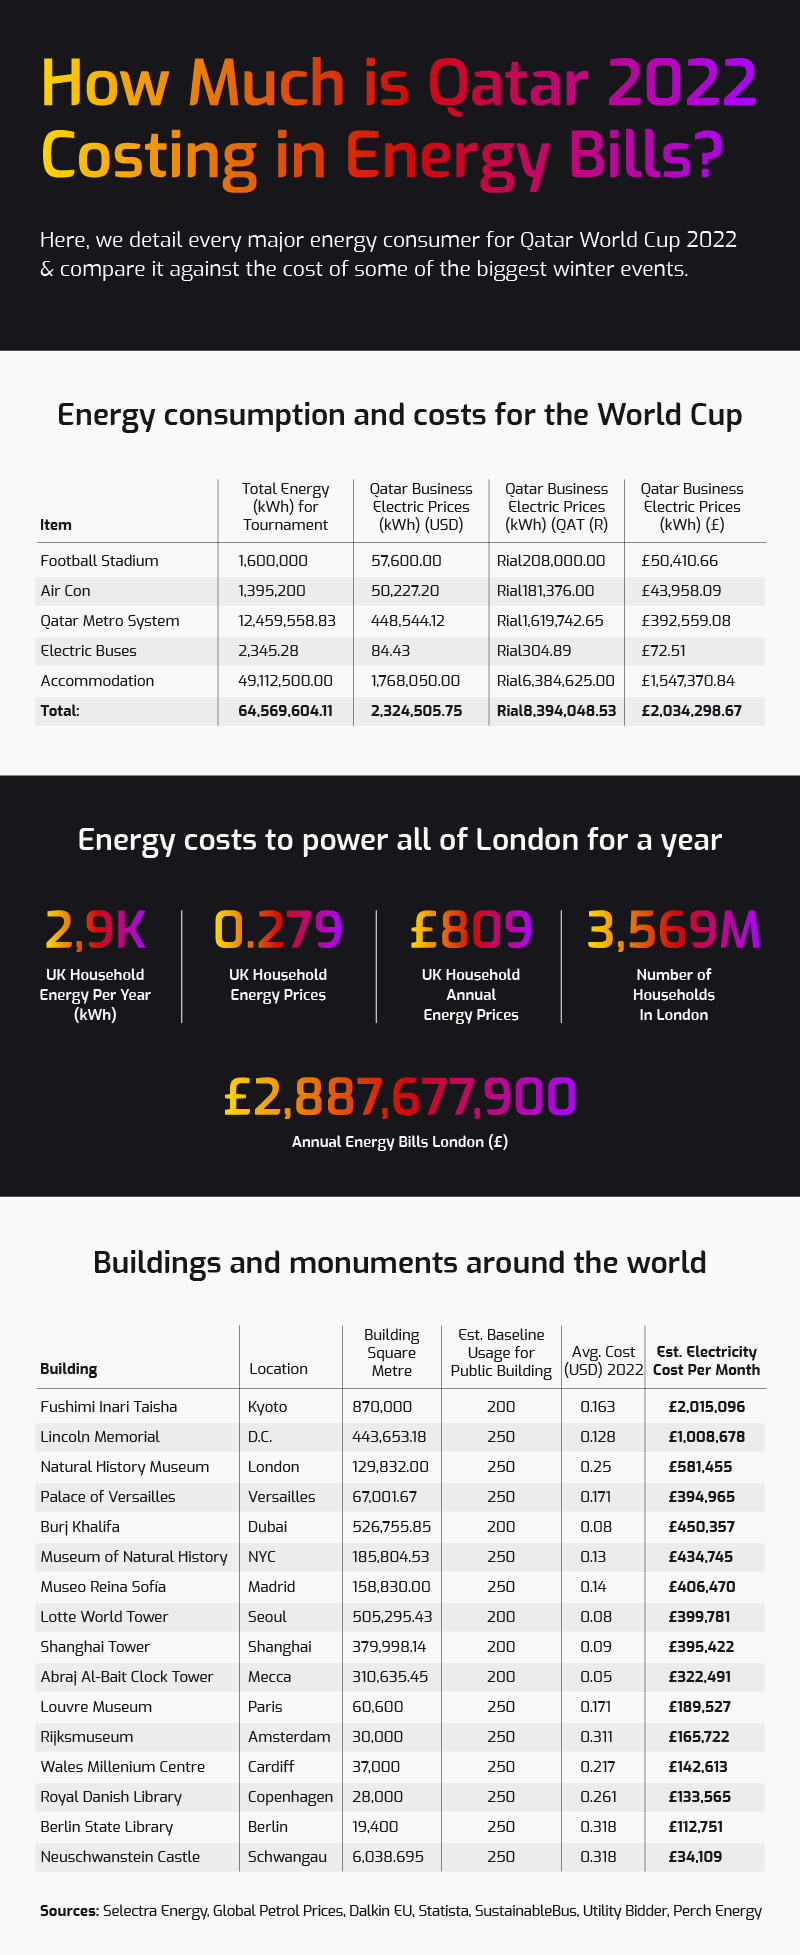
First up, we crunched the numbers of the business energy prices in Qatar to get an idea of just how high the World Cup costs are estimated to be. The Qatar business electric prices per kWh are $0.036 in US dollars, and £0.032 in British pounds (this compares to £0.34 per kWh in the UK). When taking into account the fact that there are 64 games during the Qatar World Cup, an estimated $57,600 (£50,410) will have to be spent to power the football stadium throughout the games. Another estimated $50,227 (£43,958) will need to supply the stadium with air-con, in order to keep players and fans as comfortable as possible.
Other aspects to be taken into account are the costs of external tourism that the World Cup will inevitably bring. When it comes to accommodation for fans wanting to be a part of the big game, a staggering $864k (£756.1k) will have to be spent on energy costs, as well as another $869.7k (£761.2k) for private apartments as part of Qatar’s tourist accommodation.
The MSC Cruise Ships, which are also being used for extra accommodation, and additional transportation, such as electric buses and a brand new 76km metro system, all tally up to a jaw-dropping $2.3 million (£2 million) in energy. This is because 64.5 million kWh of energy will have to be expended to power the additional accommodation and transportation throughout the World Cup.
Whilst efforts have been taken to help reduce long-term emissions in the country through he construction of the World Cup – including building a new metro system, multiple stadiums and accommodation – it has also resulted in an output of 1.6 million T CO2 emissions that hasn’t been factored into these calculations.
How vast is the cost and energy expenditure of the World Cup?
When Qatar was announced as the host for the 2022 World Cup 12 years ago, FIFA came under fire from media outlets, sporting experts and activists for choosing a country which has such a small presence in the competitive football world with no major national team, and at the cost of a very high price.
The World Cup is anticipated to have at least double the carbon footprint of the 2014 and 2018 tournaments in Brazil and Russia. The claim it will be “carbon-neutral” has been strongly challenged as it’s been revealed that FIFA’s efforts to reduce its footprint doesn’t involve removing carbon, and so cannot be called carbon offsetting.
The estimated carbon waste is expected to be around 10 million tonnes, despite FIFA’s pledge to reach net-zero emissions by 2040. Qatar authorities claim the number of emissions to be closer to 3 million tonnes, however, many believe this to be not true.
To put into context, the amount of energy and cost involved in powering the World Cup, we found that £2 million – the predicted energy costs of the tournament – would be more than enough to cover the energy bills of every household in London for 6 months, a price which comes up to just £1.4 million. That’s an estimated 3.5 million households with their energy bills paid off.
When crunching the numbers on some of the biggest landmarks from the World Cup finalist countries, we found that it cost more to power the tournament for a month than to power one of Japan’s most popular landmarks, Fushimi Inari Taisha, for a whole year.
The Japanese shrine, which spans 870k square metres and attracts over 10 million tourists a year, costs £2.015 million per year, compared to this year’s World Cup at £2.034 million. Qatar’s price of energy is already lower than Japan’s per capita fossil energy consumption, meaning Qatar’s usage has a more detrimental effect on the environment than Japan’s more renewable energy.
To illustrate this further, take France as an example, as one of the many European countries currently facing an energy crisis – and yet, despite the hiking energy prices, the Louvre Museum’s monthly energy costs are still significantly lower per month at £189.5k.
The Cost Of The World Cup In Every Country
To further our research into just how much the World Cup in Qatar is going to cost to power, we compared the energy costs from past host countries, as well as the countries that have qualified for the final this year.
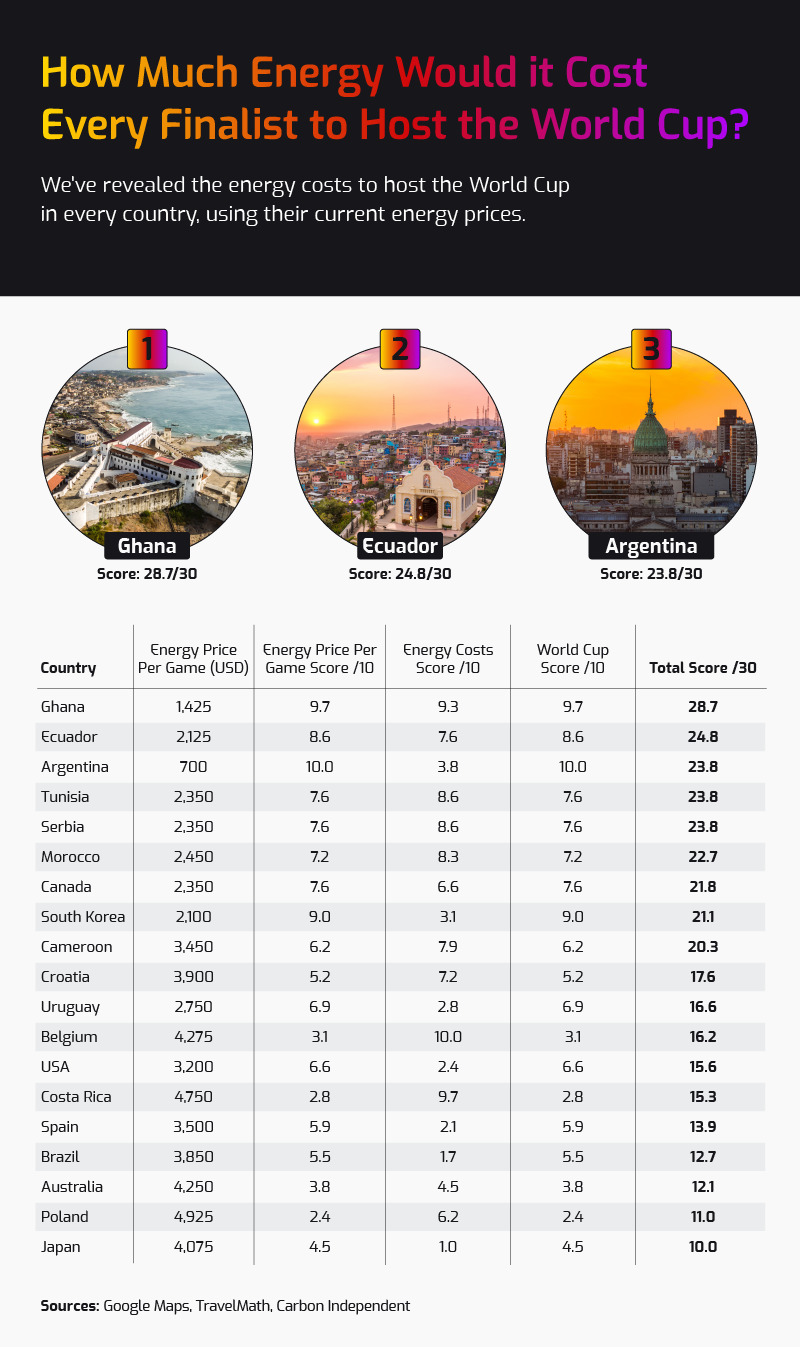
This took into account the estimated energy costs of the 64 games in the 2022 cup, as well as the number of home games each of these countries has already hosted to qualify. By scoring each country out of a potential 30, we were able to determine which location hosted this event for the least amount of money and energy.
Ghana
First on the list was the West African country Ghana, whose team qualified for the 2022 World Cup. This destination scored an almost perfect 28.7/30, which was helped by their energy costs score of 9.3/10.
The overall cost for all of the four games played in the Ghana qualifiers came to $5.7k (£4.9k), which meant that their energy prices per game (which cost $1.4k or £1.2k) allowed them to rank 9.7/10 in this section. However, if Ghana were to host the World Cup with 64 total games, the total cost would come to $91.2k.
Whilst Ghana would be a cheap option for the World Cup, it isn’t considered one of the most sustainable countries to be selected as host if FIFA is serious about its pledge to have their tournaments net-zero by 2040. Just 36.30% of Ghana’s electricity comes from renewable sources and just 0.30% of their energy is from solar sources.
Ecuador
Next up, we had Ecuador, who first played in the World Cup in 2002. They scored a respectable 24.8/30 on our list, with an overall energy costs ranking of 7.6/10. This could be down to the fact that the energy cost for every game to be played here would be $19.1k (£16.8k) overall.
This estimation is based on business energy prices in Ecuador per kWh being around $0.085 (£0.075), which would mean each game would cost $2.1k (£1.8k) individually. In conclusion, Ecuador scored 8.6/10 for their energy prices per game, making them a worthy contender for second place. If Ecuador were to host the next World Cup with 64 games, the total energy cost would come to $136k.
When it comes to Ecuador’s electricity usage, a whopping 81% of its electricity usage comes from renewable sources. Solar energy in Ecuador is only 0.5% of their total energy use, however, which gives them a sustainability score of 11.4.
Argentina
Argentina is the fourth country with lower costs for the World Cup, which hosted the event in 1978. The country boasted a respectable score of 16.2 out of 20.
With energy prices for businesses being $0.028 per kWh, giving the country an energy price per game score of 10 out of 10. If Argentina were to host the World Cup with 64 home games, the total energy cost would come to $44k, one of the lowest costing countries to host in the future.
With Argentina being a more moderately priced option for the World Cup, it’s also one of the most eco-friendly options. With 26% of Argentina’s energy coming from renewable sources such as solar power and renewables, FIFA will have its eyes peeled on Argentina’s bids as its low carbon footprint can coincide with the country’s net-zero pledge.
The Cost of the Next World Cup
In four years, the 2026 World Cup will be held across the USA, Canada and Mexico with the three neighbouring nations coming together as hosts. This will be the first time the World Cup will include 48 national teams qualifying, expanded from the usual 32. This raises questions on if this fits with FIFA’s net-zero pledge, considering there will now be 80 games played.
This not only increases the energy cost, but also carbon emissions. The USA will host 60 games of the tournament, whilst Canada and Mexico will host 10 each. This means that the cost of energy for the USA alone will come in at $200k with energy prices currently sitting at $0.128 per kWh, and that’s not including the 20 games in Canada and Mexico.
With energy in Canada coming in at $0.094 per kWh, the price of 10 games will come in at $32k. In Mexico, 10 games will cost $42,500 with currency energy prices there at $0.170 per kWh. In total, this adds up to $274,500, making it a pricey world cup for energy costs.
The Qatar World Cup, In Air Miles
Whilst FIFA has claimed the Qatar 2022 World Cup to be carbon-neutral, questions have arisen on whether any large-scale, global event can ever be completely carbon-neutral.
Tickets for the World Cup have reached 2.45 million, with fans flying from all over the globe to the Qatar 2022 World Cup, with journeys producing thousands of tonnes of CO2 emissions.
According to Doha News, the top 10 purchasing countries of tickets for the World Cup sold are Qatar, the United States, Saudi Arabia, England, Mexico, the United Arab Emirates, Argentina, France, Brazil and Germany.
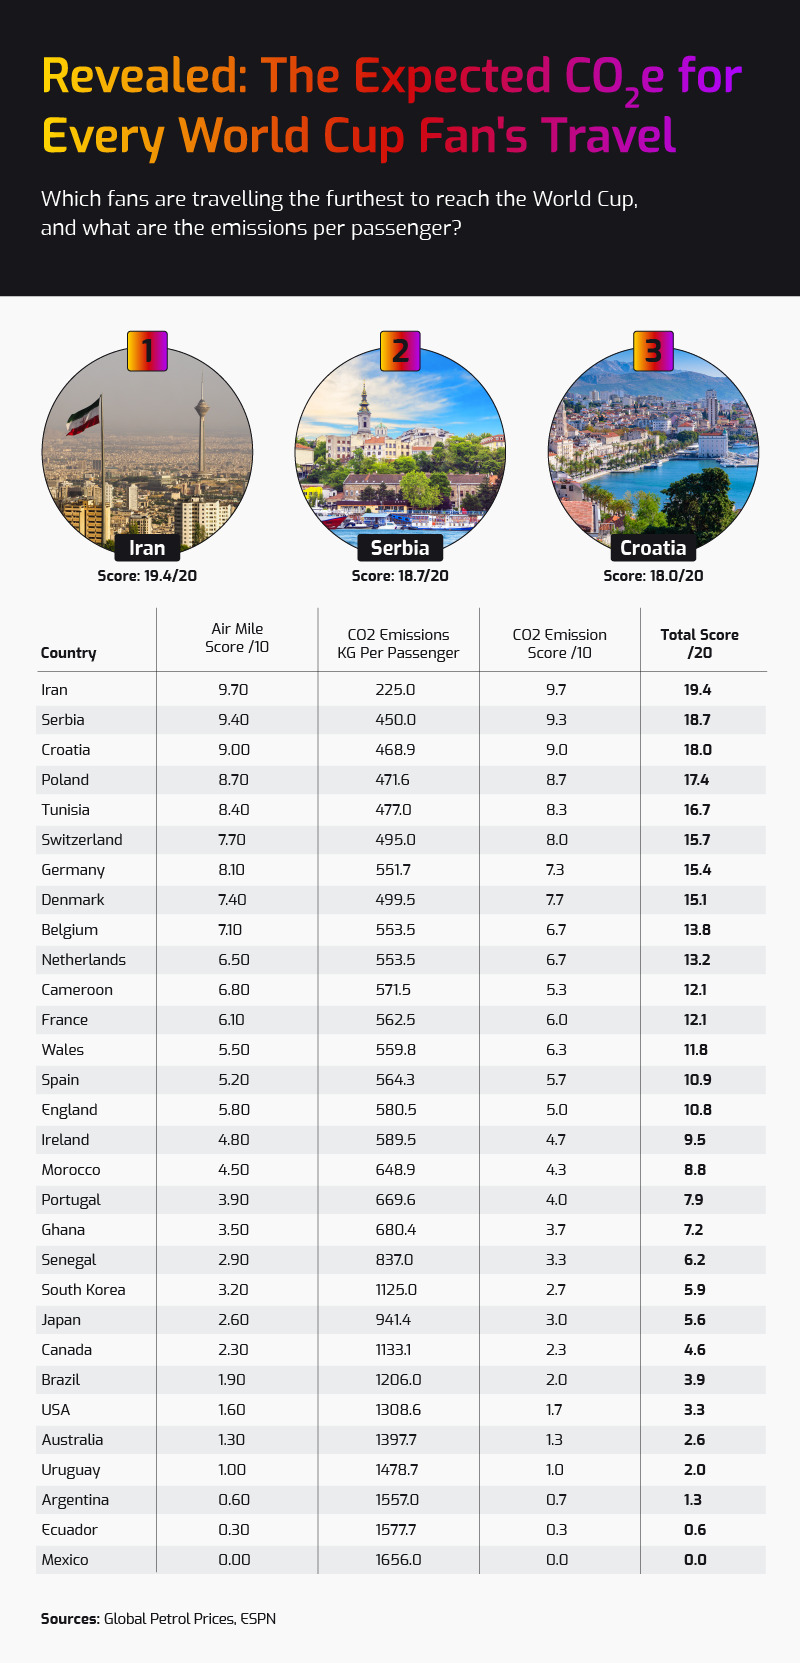
Second to Qatar, the United States comes up as the next biggest audience with over 146,000 fans travelling. Based on an average 15-hour flight from the US to Doha, the total American fans can expect to use up to 191,055 tonnes of CO2 emissions by flying. To offset these carbon emissions, 1,146,330 trees would need to be planted.
Over 91,000 fans are expected to land in Doha for this year’s World Cup from Mexico, which is 14,434km away. Based on each passenger using up to 1,656kg of CO2 emissions per 18-hour flight, fans travelling from Mexico are estimated to use up to 150,696 tonnes of CO2 emissions. This means that 905,814 trees need to be planted to offset these emissions.
91,000 fans are expected to fly to Doha from England, amounting to 580.5 kg of CO2 emissions per passenger, per 6-hour 45-minute flight. This means that English fans are expected to produce 52,825.5 tonnes of CO2 emissions when travelling to the 2022 World Cup. To offset England’s CO2 emissions, 316,953 trees would need to be planted.
Whilst the World Cup has the third biggest audience with 123,000 Saudi Arabian fans. Saudi Arabia produces the least amount of CO2 emissions per flight, with a flight time of only 2 hours and 10 minutes. However, with 123k fans contributing 189 kg of emissions per flight, the total number of CO2 emissions used comes to 23,247 tonnes. To offset these emissions, 139,482 trees would need to be planted.
For these top four countries producing the most CO2 emissions from flights, a total of 2,508,579 trees would need to be planted, and that’s just from the four largest polluting countries alone.
If the entire Qatar World Cup is producing around 10 million tonnes of carbon emissions, around 600 million trees would need to be planted in order to offset the tournament’s emissions.
And whilst it’s unlikely that 2.45 million fans will ever travel across the world Greta Thunberg style, there are ways to travel more sustainably. From booking with eco-friendly airlines to considering carbon-conscious accommodations and supporting local businesses, sustainability is going to be a big question on fans’ minds going forward.
The Most Eco-Friendly Countries To Host The Next World Cup
With all this being said, and climate experts and media outlets highlighting the environmental impacts of these global events, what will become of the future of our much-loved sporting events? Is there a way to host such a large-scale event with minimal carbon emissions?
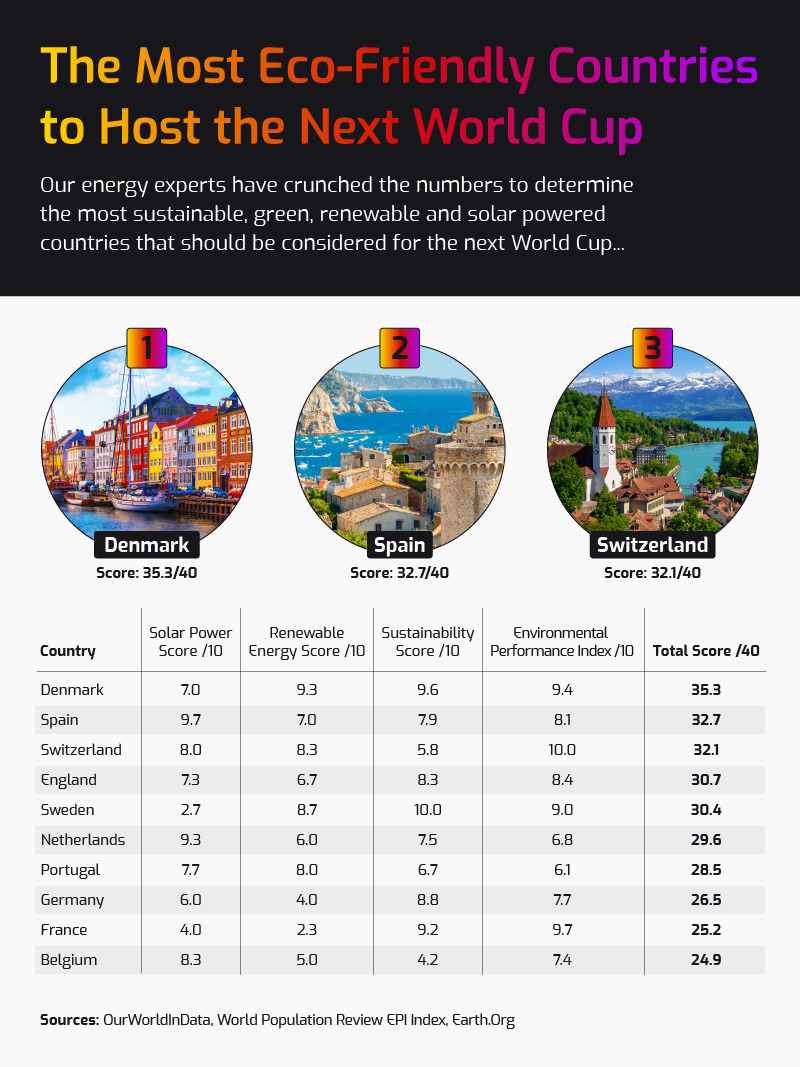
Whilst we know that Mexico, USA and Canada are being considered for the 2026 FIFA World Cup, our energy experts have crunched the numbers and determined the most sustainable, green, renewable and solar-powered countries, looking at how much renewable energy each country uses and how green their policies are.. If a future World Cup was chosen based on these factors, these countries would be the most eco-friendly destinations to host.
Denmark
Denmark leads the way as the most environmentally-friendly location to have the World Cup, with an impressive score of 35.3 out of 40.
The Scandinavian country known for its scenic, natural beauty also received a green score of 9.4/10, a 9.6/10 for its sustainability and 7/10 for its solar power. The country also received a respectable 9.3/10 for its renewable energy sources, with 78.05% of the electricity that comes from the country being renewable.
Spain
Spain steals the spot of the second most sustainable country to host the next World Cup tournament with an environmentally-friendly score of 32.7 out of 40.
It’s no surprise that sunny Spain has a solar power score of 9.7/10, having the second-highest percentage of electricity that comes from solar power on the list at 9.85%. The country also has a green score of 8.1/10, a sustainability score of 7.9/10 and a renewable energy score of 7/10.
Switzerland
Switzerland climbs the ranks to third place for being one of the most eco-friendly destinations to host the 2026 World Cup with a score of 32.1 out of 40.
The picturesque country home to the high peaks of the Alps and a number of scenic lakes received full marks for its green score (10/10). A promising 63.83% of the electricity that comes from the country is renewable, giving Switzerland an 8.3/10 renewable energy score, alongside its sustainability score of 5.8/10 and solar power score of 8.0/10.
– END
Methodology:
How much is Qatar 2022 costing in energy: We looked into Qatar’s business energy prices along with the prices of accommodation, transportation and construction energy used to power the 2022 World Cup.
The cost of the World Cup in every country: Based on each country’s business energy prices, we’ve determined the cost of energy usage per game held, and applied that to if every country had played 64 World Cup games, and which countries came out with the lowest costs.
We’ve used CO2e data to then verify the number of renewable energy resources in each country.
The Qatar World Cup in air miles: Based on the average passenger using 90 kg of CO2 emissions per hour, per flight via Carbon Independent Org, we’ve determined the total number of fans expected Co2e based on the number of tickets sold and average flight times.
Data from ShipIt confirms six trees need to be planted to offset 1 tonne of emissions.
The most eco-friendly countries: Looking at World Population Review’s rankings of greenest countries, and Our World In Data Org, we’ve found the most eco-friendly countries that should be considered for the next World Cup.
*All data correct as of 16/11/22. All currency conversion figures are correct as of 16/11/22.


